You can download Pivot + Camrilla Calculator from here
http://www.4shared.com/file/A7YyIeb7/PIVOT_POINT_CALCULATOR101.html
You can download Fibonacci Calculator from here
http://www.4shared.com/file/N_LyqbHg/Fibonacci_Calculator_01.html
For time being I am not much active in stock market.
Monday, November 7, 2011
Sunday, August 7, 2011

Monday, August 1, 2011
Sunday, April 10, 2011
Saturday, February 12, 2011
Simple Moving Averages - is it so simple?
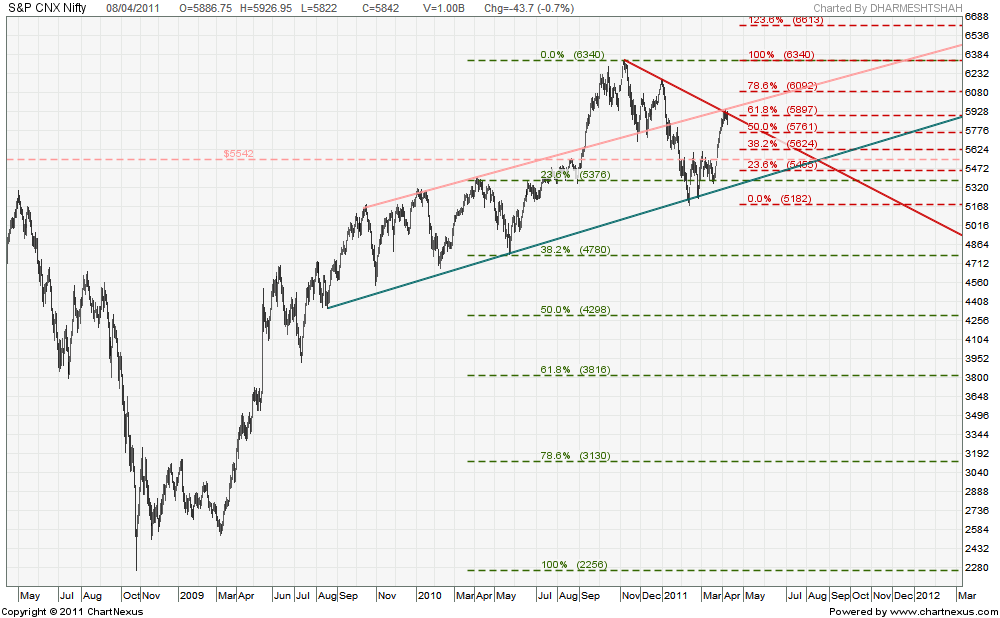
20day SMA 5522.75*, a first hurdle for the bulls.
200day SMA 5627.54*, if at all we are in bull market, nifty should take out this level and stay above it.
50day SMA 5786.64*, nifty moving above this can add bulls to the party and bears can start covering shorts.
100day SMA 5925.28*, above this level bears may go into hybernation.
100week SMA 5040.67*,can be a good immediate support.
50week SMA 5553.09*, can be a good resistance.
200week SMA 4691.63*, can be a deep panic support.
50month SMA 4662.23*, can be a second line of defence after 4691.63* for the bottom fisher.
100month SMA 3400.38*, if there is some extra ordinary situation and market gives lower circuit, near this level market can get some stability.
200month SMA 2253.82*, in case of total collapse market can rush towards this level.
* These levels are variable as the days passes.
These levels does not suggest the entry or exit point. One has to look at the market condition very carefully.
Point & Figure chart suggests that above 5350 Nifty might give a low pole reversal.
Subscribe to:
Posts (Atom)